D3 Parade
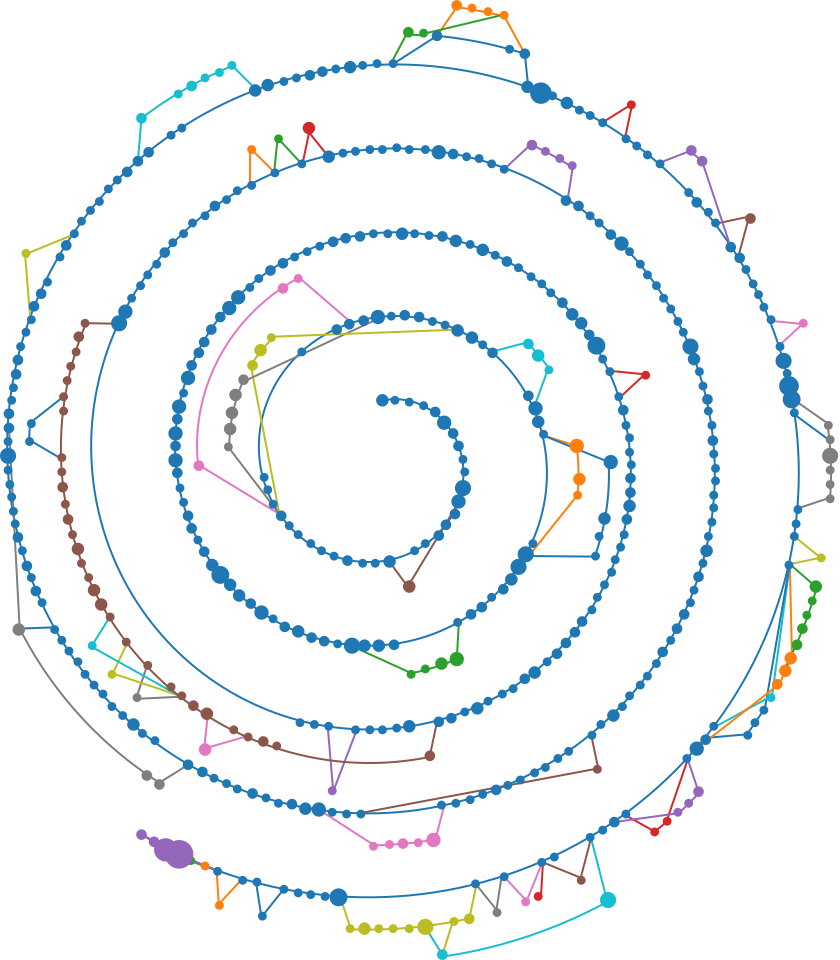
To celebrate 10 years of D3.js the D3.js Community organized a competition where you had to visualize some aspect of D3.js using D3.js! I played around with some ideas and decided that visualising the Git repositories would make an interesting visualisation especially the branching. I started by downloading all the commits of the D3 repositories via the Github API. Then I tried to see if I could use a force directed graph but I just ended up with a long line. Next I tried a long horizontal chart but there was too much scrolling. I was inspired by the way the force directed graph started curled up and then expanded into a long line. So I decided to go with a spiral - all the commits could be presented in a small space.
How was it made?
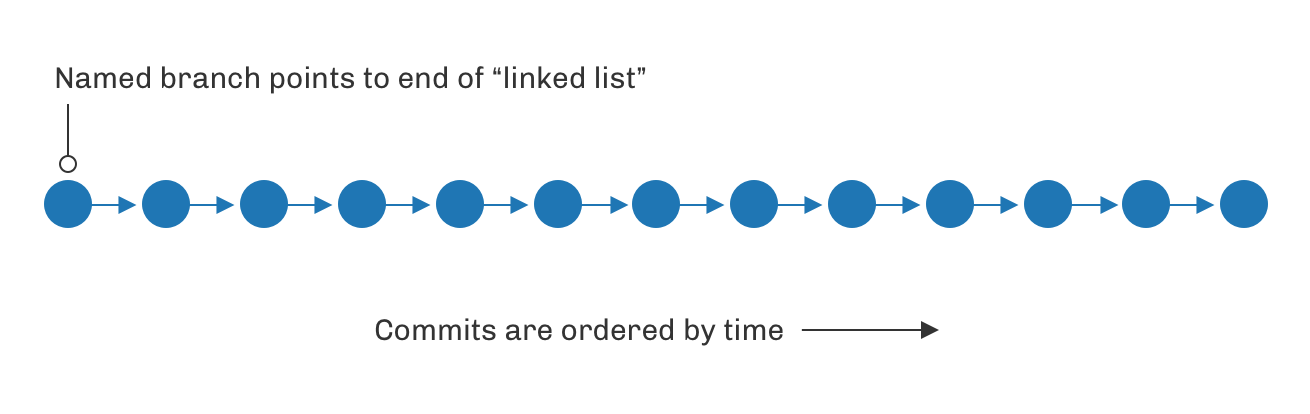
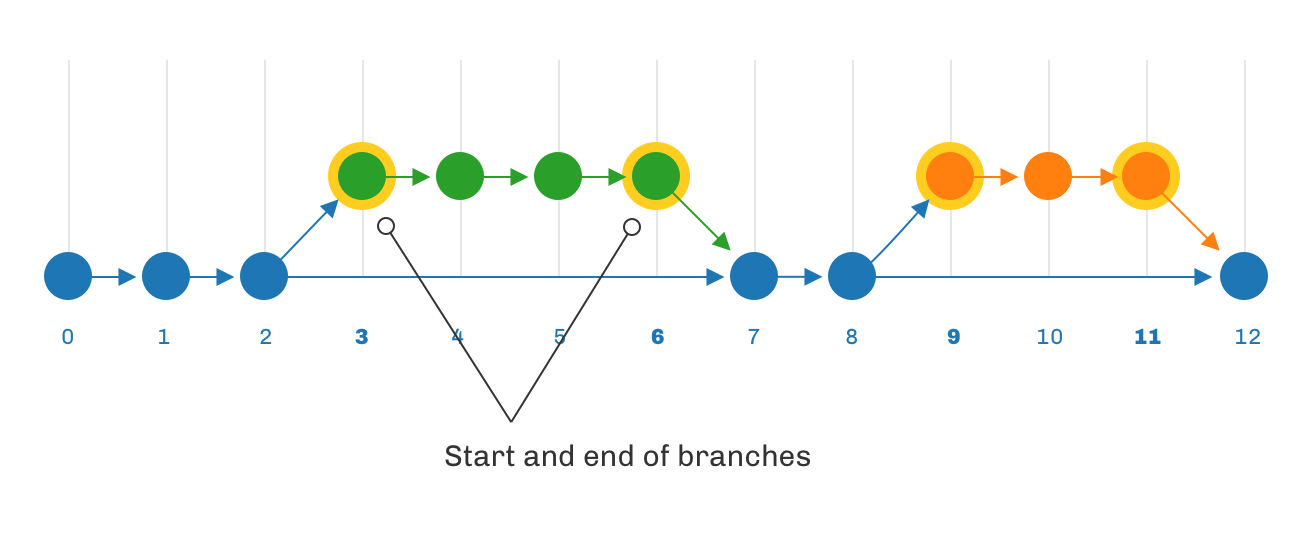
Git consists of a linked lists of commits. Named branches point to the end of one of those link lists. To start off the commits were ordered by time.
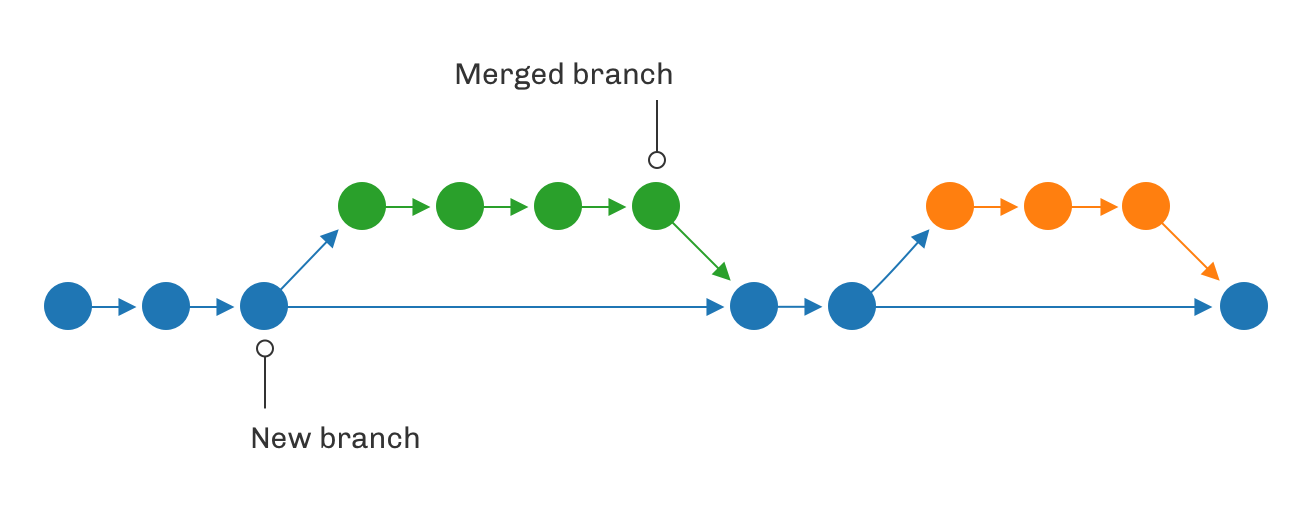
Commits can have 1 or more parents. If a commit has 2 parents it's a new branch. If a commit's parent points to an existing branch it's a merge.
Next the location of the start and end branches is found.
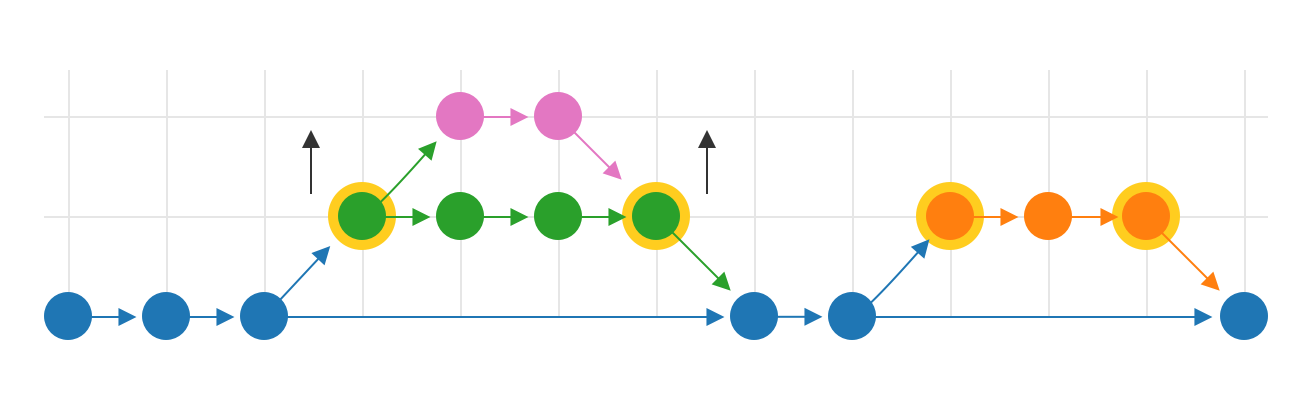
Some branches will occupy the same space horizontally so they have to be moved up until they find some free space.
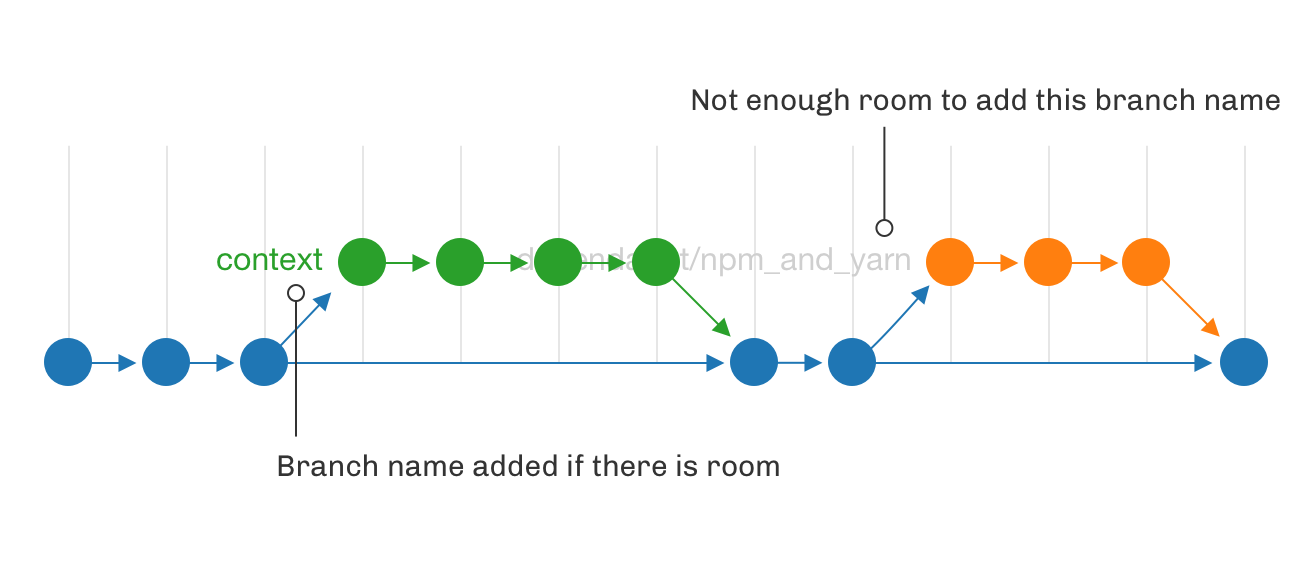
Next it works out whether there is enough room to display the branch names.
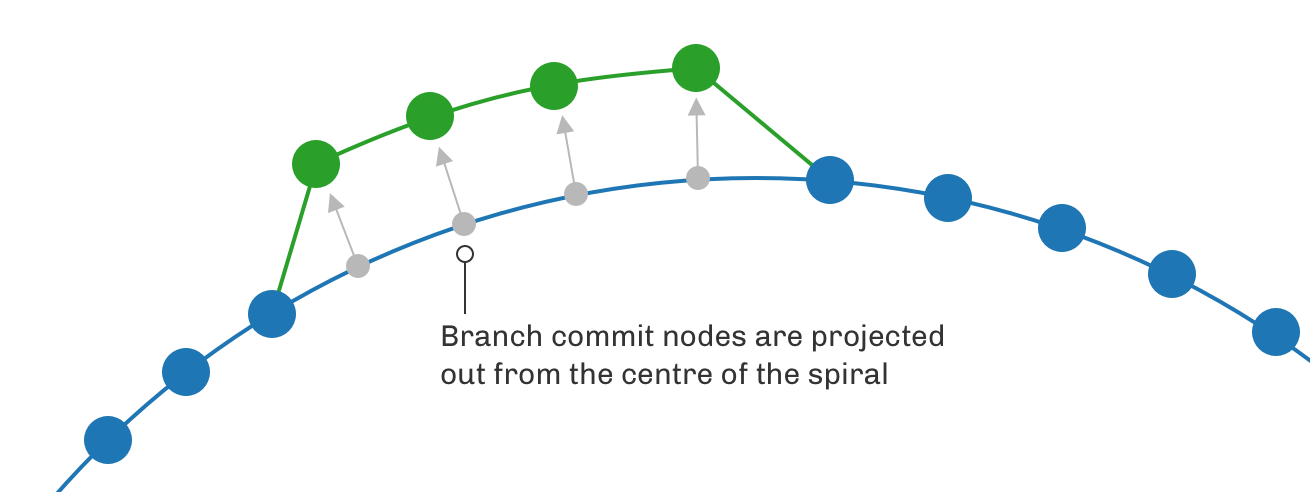
The commit nodes are then mapped onto a spiral with the help of SVG's path.getPointAtLength().